Before you begin
Make sure you have:- A OpenSRE account - you can create one at app.tracer.cloud/sign-up
- Access credentials for the tools you want to connect
- Permissions to create API keys
Connect integrations
We recommend connecting the following tools: Observability. OpenSRE reads your logs, metrics, traces, and alerts to build investigation hypotheses. Connect Grafana and Prometheus. Infrastructure. OpenSRE maps your environment and dependencies across clouds and clusters. Connect AWS. Communication. OpenSRE delivers investigation reports where your team already works. Connect Slack. Knowledge. OpenSRE references your runbooks, investigation guides, and architecture docs so it knows your systems the way your team does. Upload docs from your device.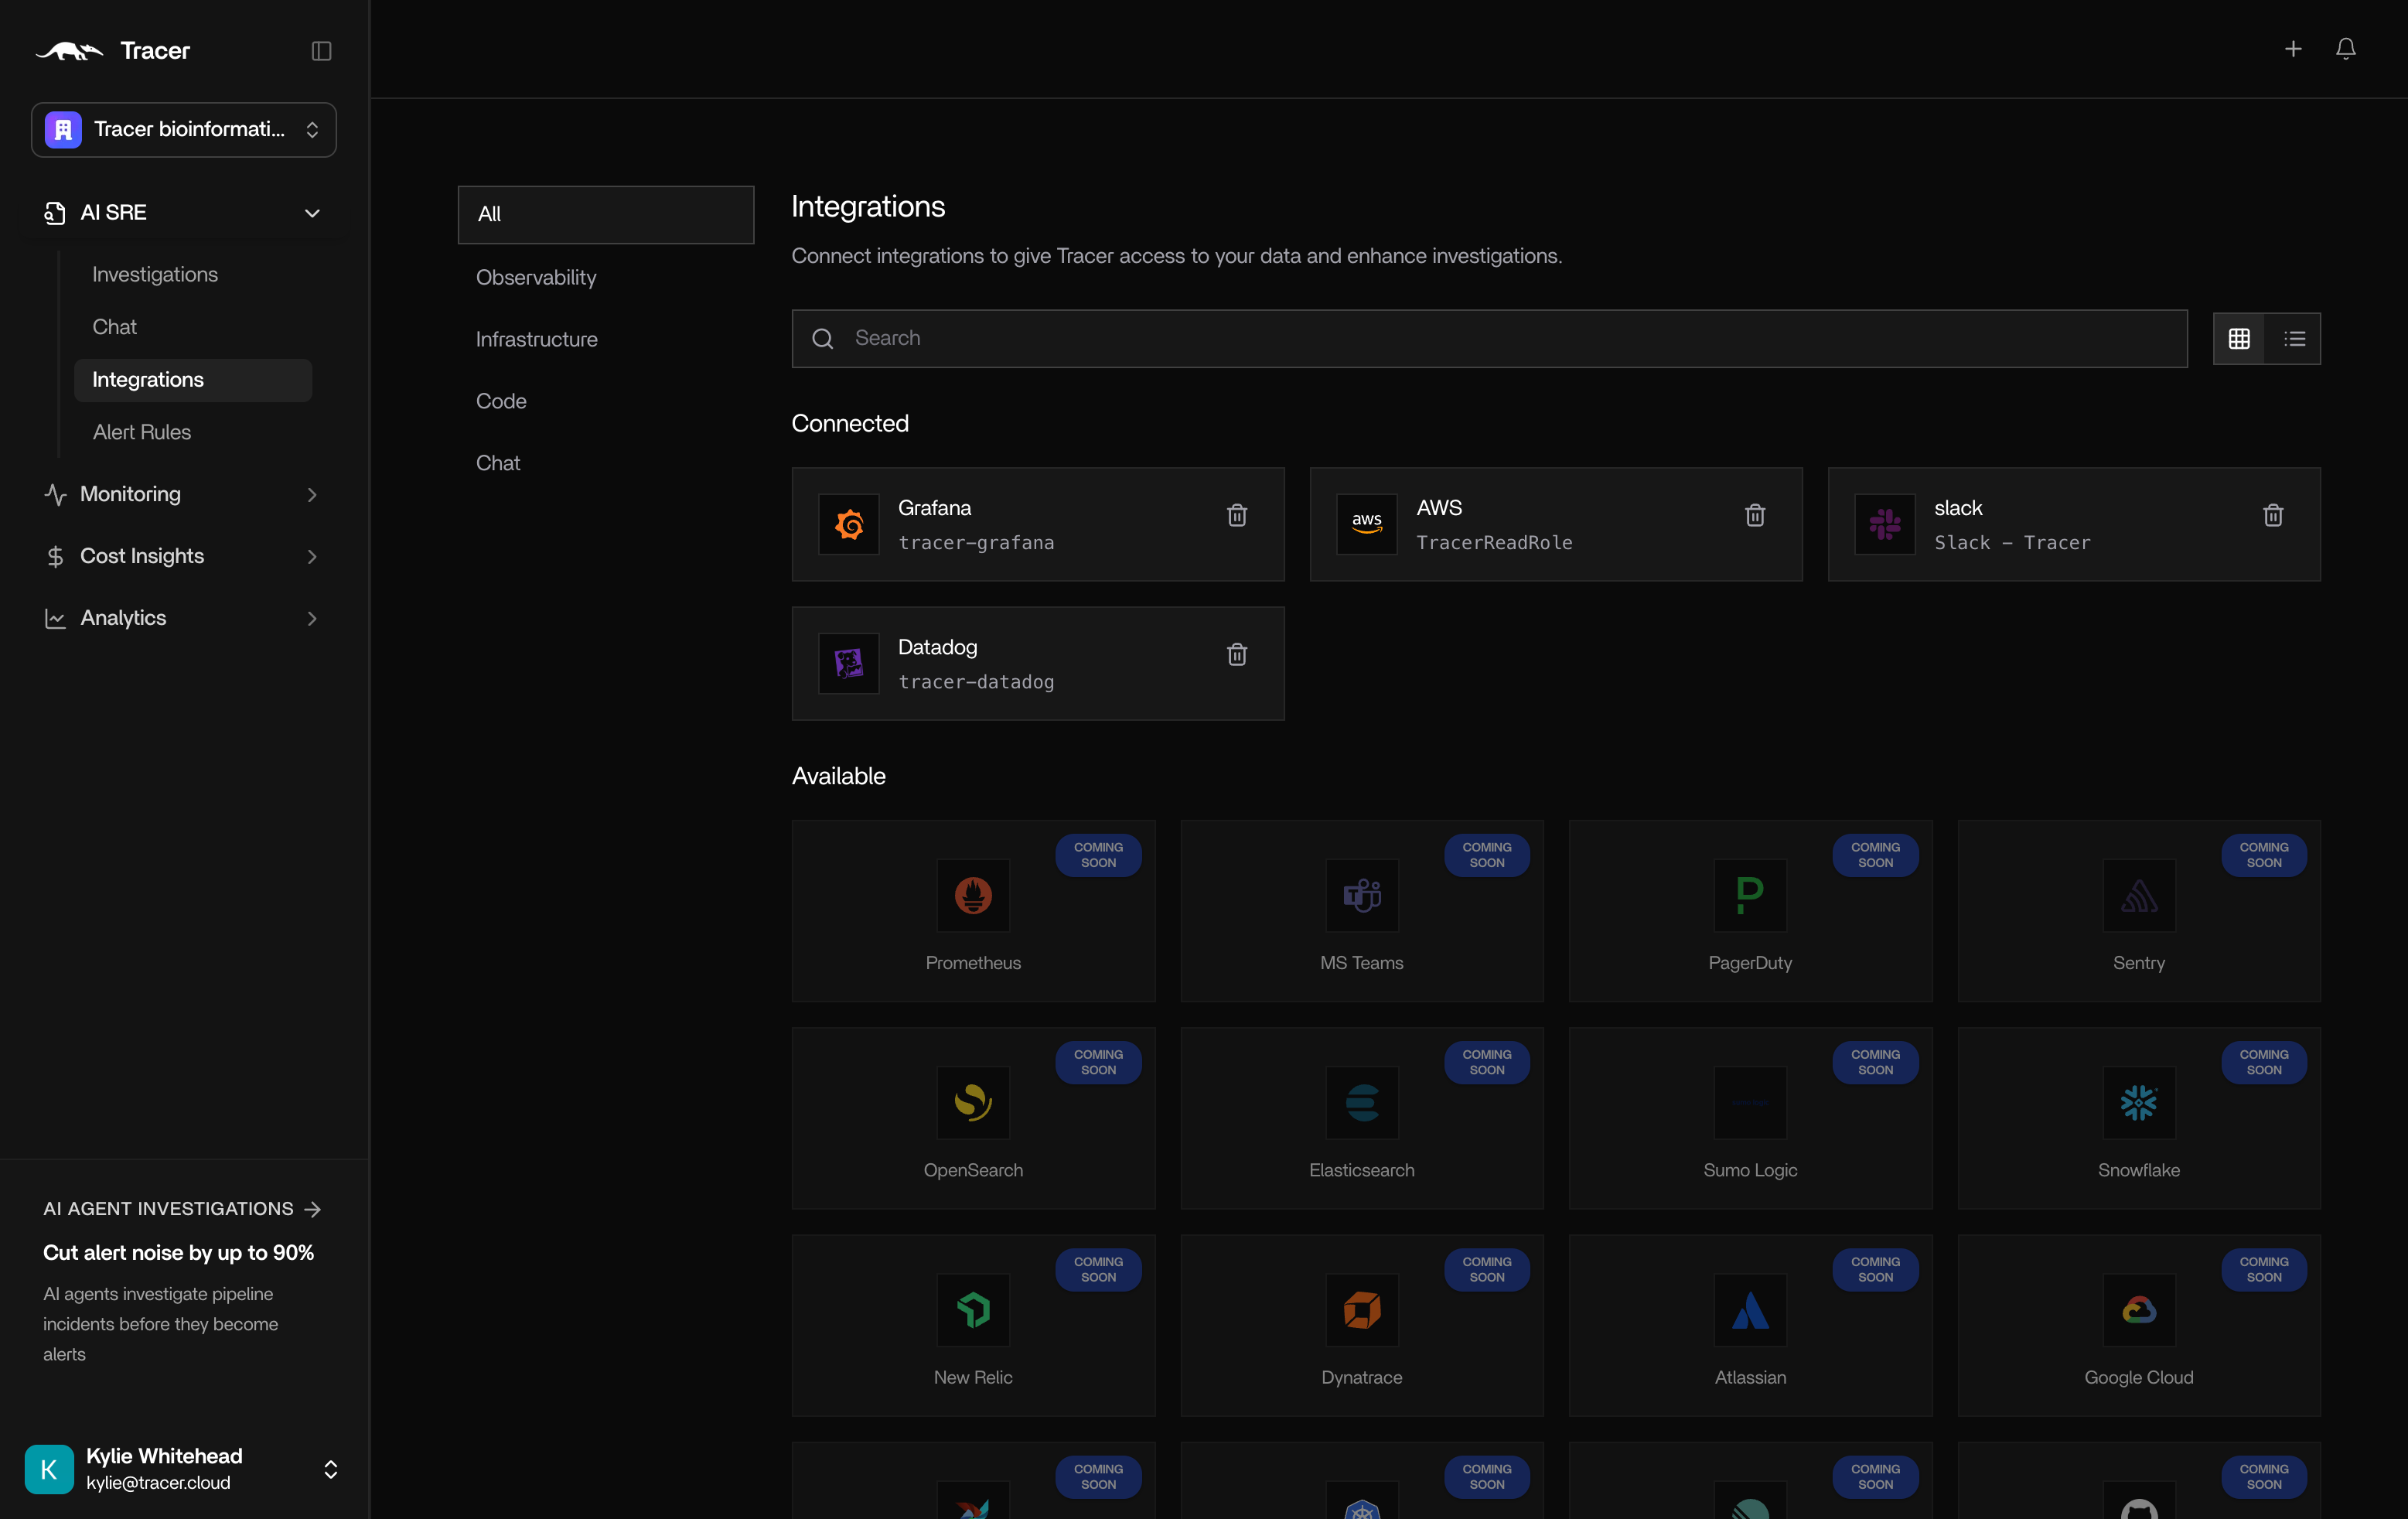
Configure integrations
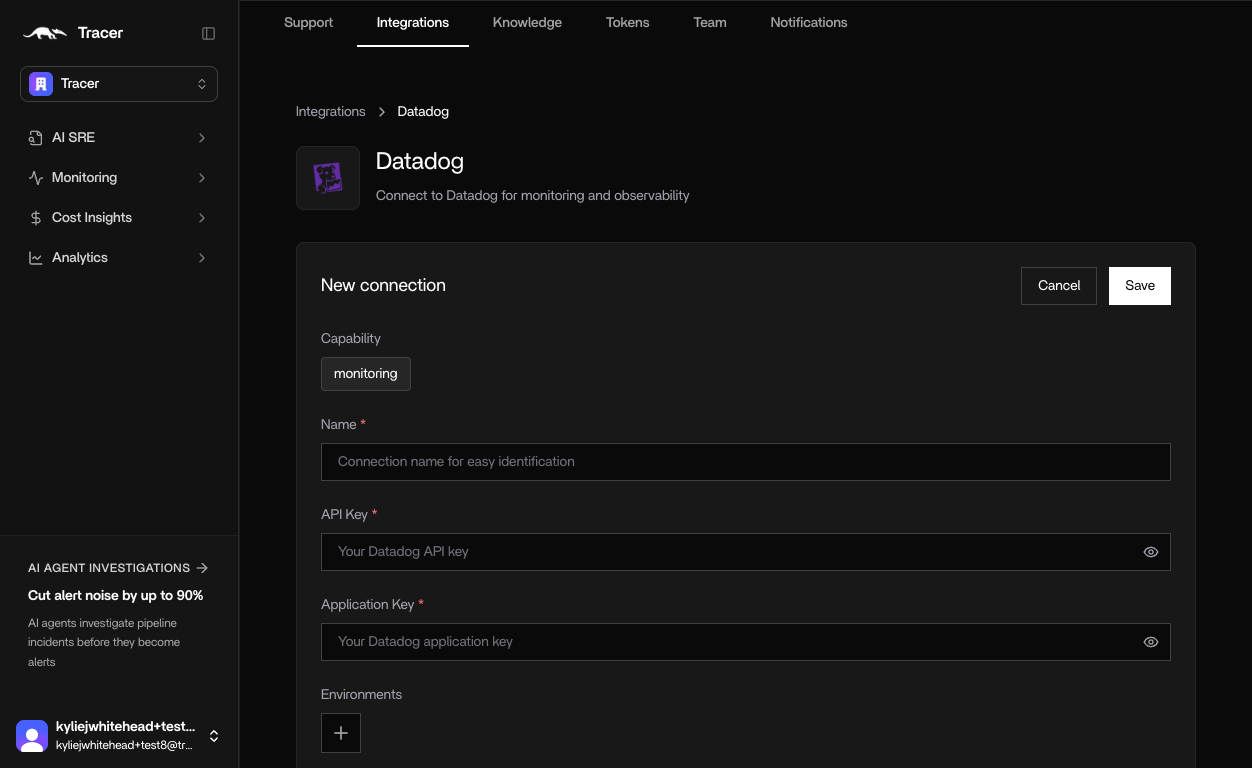
Each integration follows a simple, guided flow. Let’s look at Datadog as an example.- Name - Helps distinguish between different instances
- API Key - in Datadog, create a new API key and copy and paste into OpenSRE.
- Application Key - In Datadog, create a new Application Key and copy and paste into OpenSRE.