

Overview
OpenSRE can watch the log file written by a Hermes deployment (typicallyerrors.log), turn new lines into structured incidents, optionally deduplicate and escalate them, and deliver alerts to Telegram or Rocket.Chat. This page is about that log tail + classifier + delivery path — separate from OpenSRE’s own runtime logs.
OpenSRE can watch the log file written by a Hermes deployment (typically errors.log), classify new lines into structured incidents, optionally deduplicate and escalate them, and deliver alerts to Telegram.
This page covers the log watch + classifier + Telegram path and the investigation tool get_hermes_logs. Configure the investigation tool with opensre integrations setup hermes and check the saved path with opensre integrations verify hermes.
Delivery uses the same credential model as the rest of OpenSRE, for either provider. Telegram: configure once with
opensre integrations setup telegram — hermes watch resolves the token from the integration store, environment, or keyring; set TELEGRAM_BOT_TOKEN / TELEGRAM_DEFAULT_CHAT_ID directly, or pass --chat-id. Rocket.Chat: pass --provider rocketchat and configure via opensre integrations setup rocketchat or ROCKETCHAT_* env vars. See Telegram and Rocket.Chat.
The watcher uses a rotation-safe tailer. If the file is missing at startup, it waits until it appears. Use
--from-start only when you intentionally want to replay existing contents (default avoids flooding Telegram on restart).
HERMES_LOG_PATH is read by the get_hermes_logs tool (default path and path sandbox). Pass --log-path for opensre hermes watch when the log is not at the default location.
Prerequisites
- A Hermes deployment that writes an
errors.log(or another log you point at with--log-pathforhermes watch;HERMES_LOG_PATHis for theget_hermes_logstool) - Telegram configured for alert delivery (bot token and chat ID) — see Credentials and Telegram
- For
--investigate: LLM and integrations configured as for any OpenSRE investigation (quickstart)
Setup
Configure the log file used by investigations:~/.hermes/logs/errors.log and only saves a readable regular file. It also sets HERMES_LOG_PATH, which defines the tool’s default path and permitted custom-log directory.
To run the long-lived watcher, use:
Common options
Environment variables
Watch with full OpenSRE RCA (--investigate)
For production on-call, run one long-lived watcher with the RCA bridge when you want LLM-backed summaries on serious incidents:
run_investigation via the Telegram sink. Work runs on a bounded thread pool with a timeout so log tailing stays responsive. MEDIUM and lower stay on a lighter notification path by default.
For ad hoc Hermes log context during another investigation (for example Grafana-driven RCA), use get_hermes_logs below — it samples the log and does not replace a long-running opensre hermes watch.
Quick check with a bundled fixture
Point--log-path at a synthetic errors.log. Prefer a scenario with ERROR / CRITICAL lines so incidents fire under the default classifier — the live watcher does not read per-scenario scenario.yml thresholds:
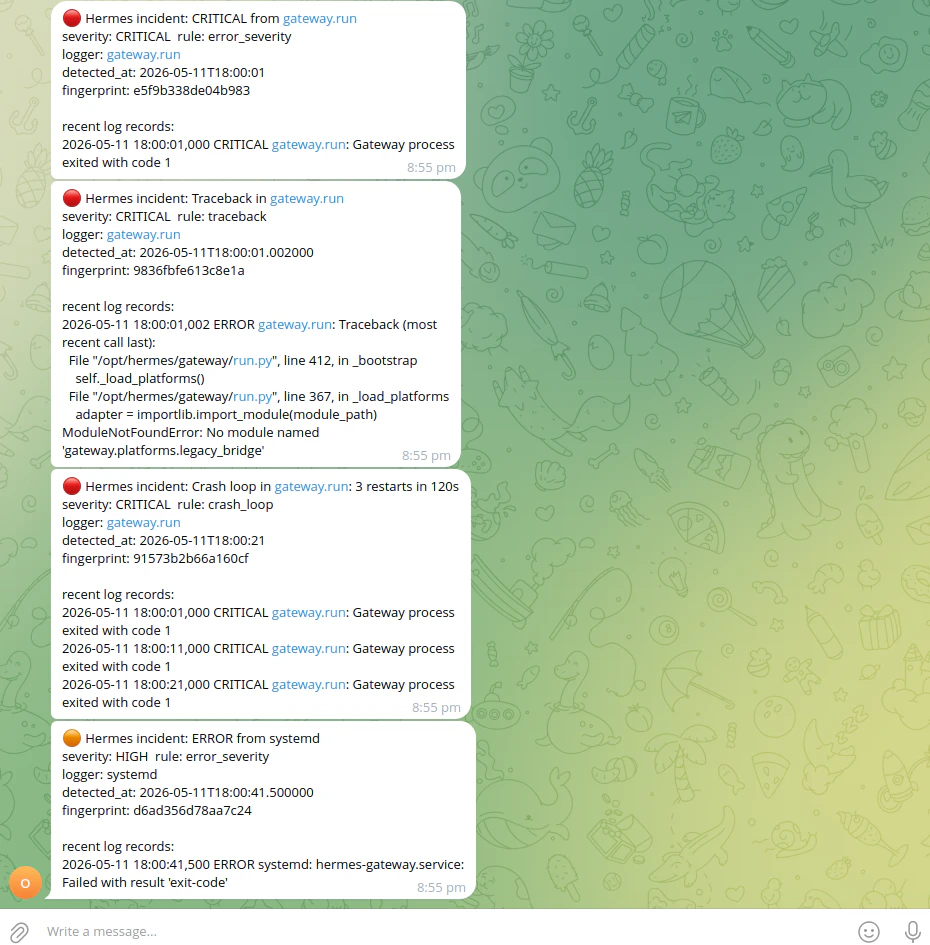
--from-start replays the file, then keeps tailing. By default, watch only reads new lines — without --from-start, a static fixture produces no events until more lines are appended. Prefer a writable copy of the scenario log if you append lines without editing files under tests/.
Omit --investigate for a lightweight demo. With --investigate, the investigation pipeline (LLM) runs for HIGH / CRITICAL only.
Correlator dedup can also reduce multiple deliveries (either provider) for the same fingerprint; check shutdown line hermes-watch: correlator metrics delivered=… — if delivered=0, the classifier did not emit any routable incidents for that run.
Credentials
Telegram uses the same credential model as the rest of OpenSRE. Configure once withopensre integrations setup telegram. hermes watch resolves the token from the integration store, environment, or keyring. You can also set TELEGRAM_BOT_TOKEN / TELEGRAM_DEFAULT_CHAT_ID, or pass --chat-id. See Telegram.
Investigation tools
During an investigation, the planner can callget_hermes_logs:
Paths are restricted to permitted directories (by default
~/.hermes, plus the parent of HERMES_LOG_PATH when set) so arbitrary file reads are blocked.
Other Hermes investigation tools
This page focuses on log watch andget_hermes_logs. Under integrations/hermes, additional session-evidence tools are also available when a Hermes backend is wired for RCA fixtures, including:
Configure LLM + integrations as for any OpenSRE investigation (quickstart). When the classifier emits HIGH or CRITICAL incidents, each qualifying incident triggers run_investigation via the sink, regardless of --provider. Work runs on a bounded thread pool with a timeout so log tailing stays responsive; MEDIUM and lower stay on a lighter notification path by default.
get_hermes_session_log, get_hermes_session_topology, get_hermes_provider_traffic, get_hermes_adapter_catalog, get_hermes_config, get_hermes_message_history, get_hermes_kv_cache_state, get_hermes_runtime_state, get_hermes_cron_state, get_hermes_orchestration_state, get_hermes_routing_decisions, get_hermes_memory_state, get_hermes_filesystem_state, get_hermes_audit_trail, get_hermes_approval_events, get_hermes_rbac_state, get_hermes_credential_state, get_hermes_workflow_run.
Troubleshooting
Why you might see no TelegramSecurity
Paths forget_hermes_logs are restricted to permitted directories (by default ~/.hermes, plus the parent of HERMES_LOG_PATH when set) so arbitrary file reads are blocked.
Extras
Local demo: synthetic tests, then watch
1 — Offline classifier checks (pytest, no Telegram) The Hermes synthetic suite feeds real-shapederrors.log slices through IncidentClassifier and asserts against answer.yml. Same loop as tests/synthetic/hermes/README.md:
tests/synthetic/:
errors.log that emits incidents under default classifier settings (see Quick check with a bundled fixture). From the repo root:
Synthetic regression suite
Contributors add scenarios undertests/synthetic/hermes/ (fixtures, scenario.yml, answer.yml). Layout, schema, and “adding a new scenario” steps are in tests/synthetic/hermes/README.md.
Further reading
- Implementation:
integrations/hermes/(tailer, parser, classifier, correlator, sinks, CLI wiring). - Surface-attribution evaluation for contributors:
docs/hermes_runbook.mdx(repo only; not on the public docs nav). - If you also run OpenClaw alongside Hermes, that page covers the OpenClaw bridge (context lookup and RCA write-back).
- For false-positive risks when rules match both
messageand raw line text, see issue #1874.