

Watch a first run
Install, set things up, and throw a sample alert at it. Most people are done in under ten minutes.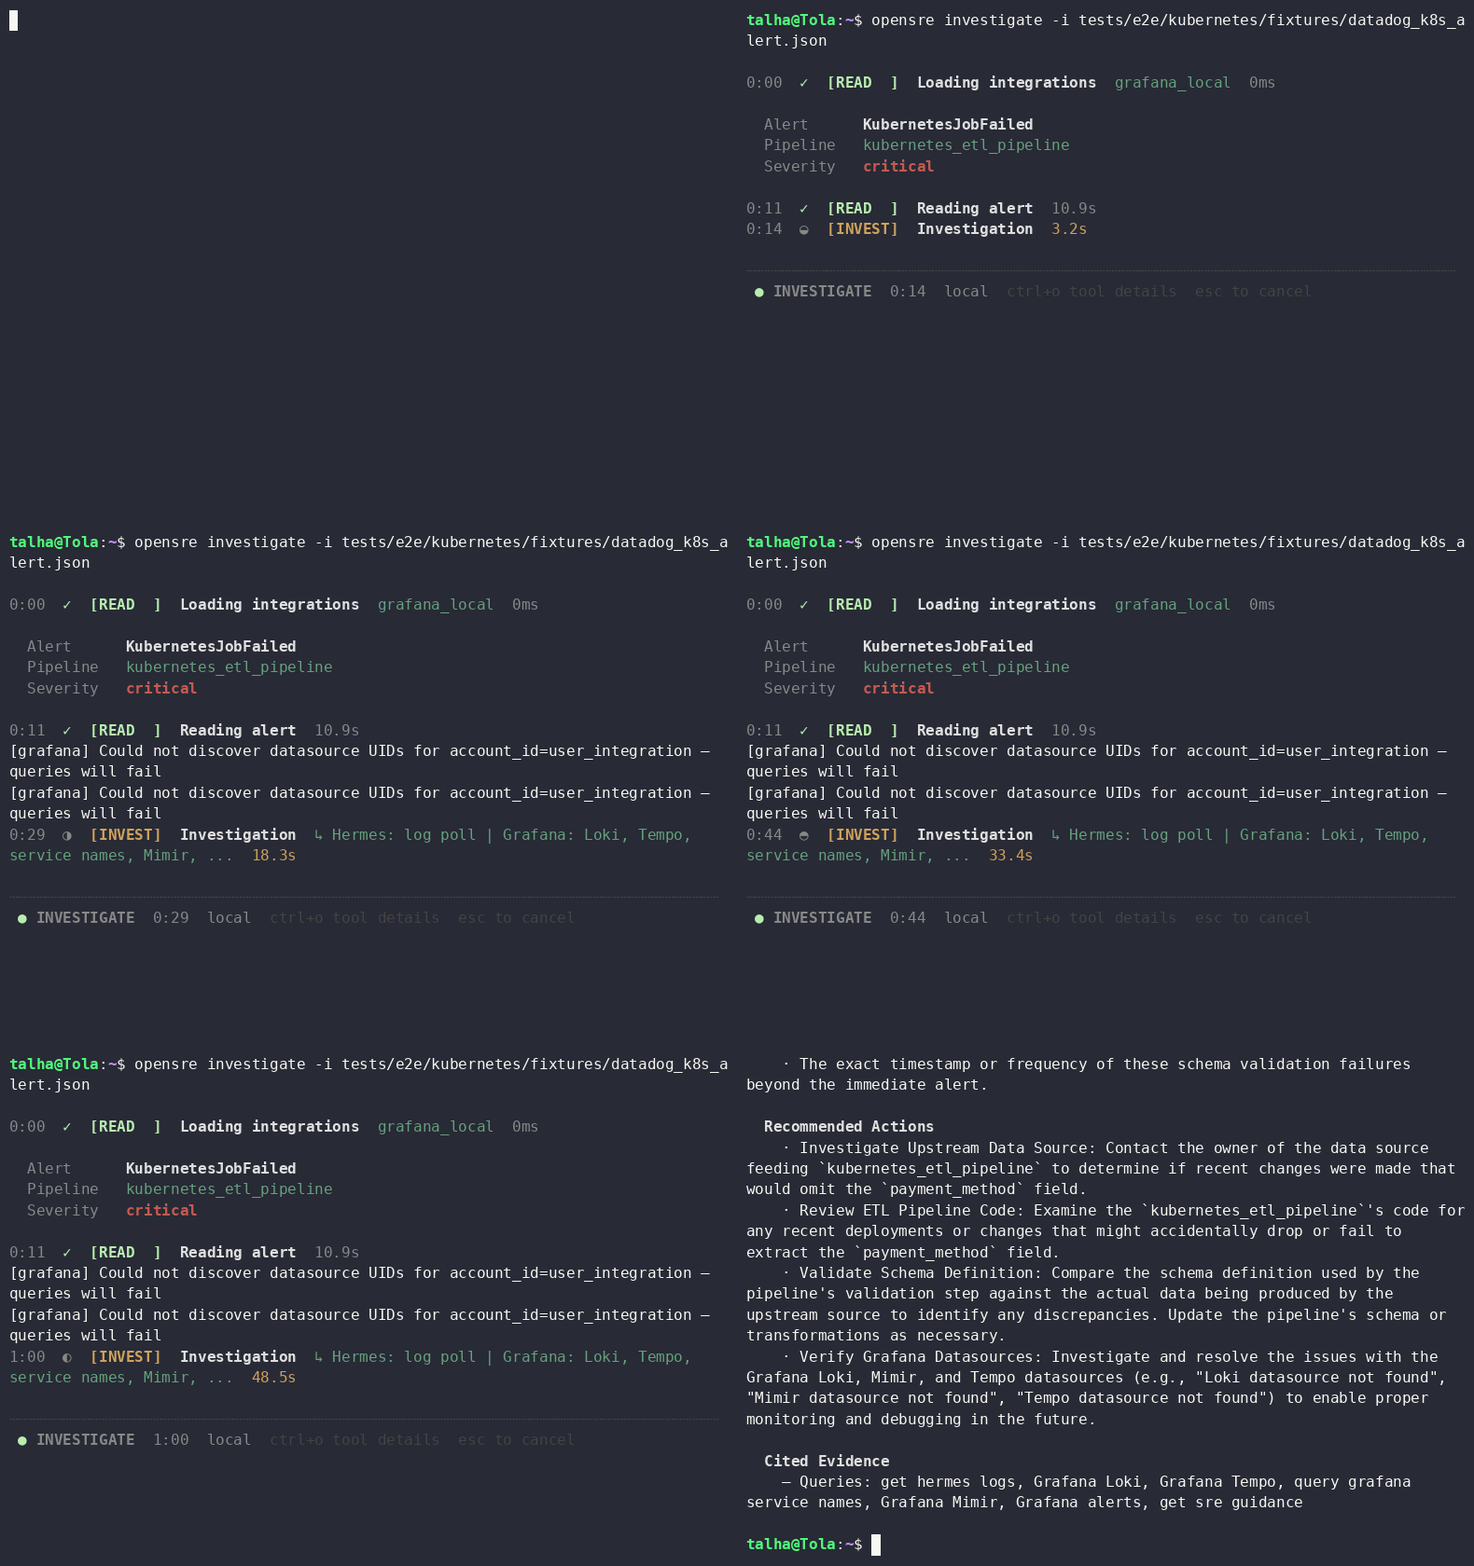
Full quickstart
Install, onboard, and run the sample alert — with screenshots for macOS, Linux, and Windows.
Jump to the GIFs
Skip straight to the install and onboard recordings.
What you get after a run
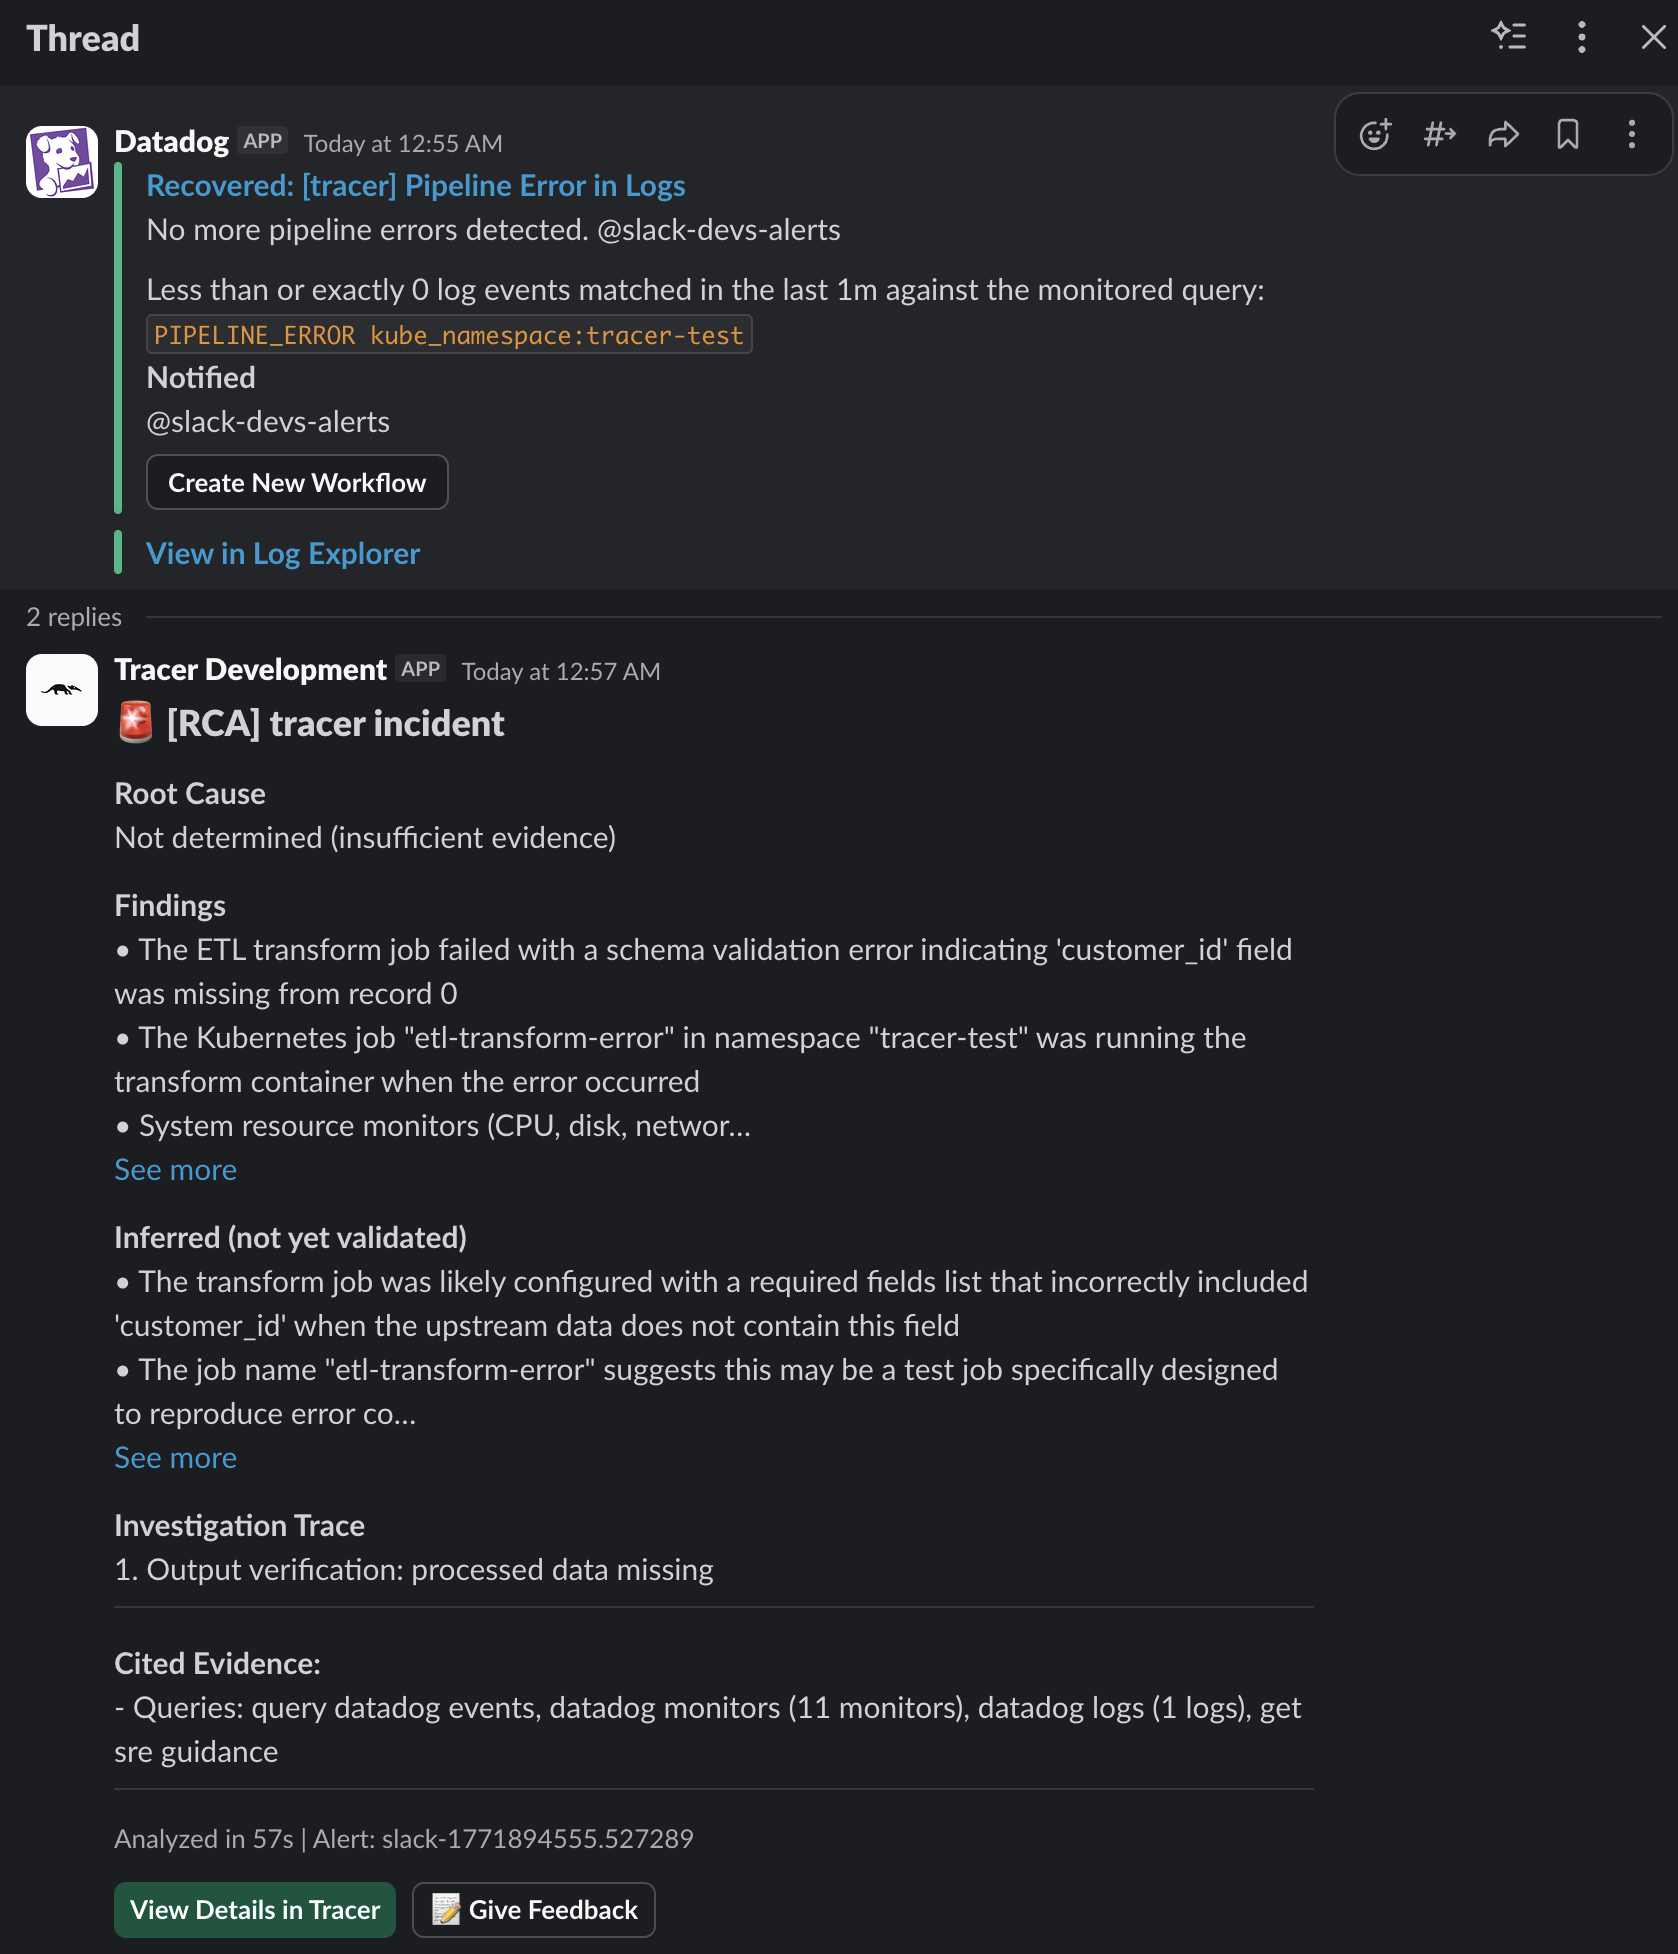
When an investigation finishes, OpenSRE drops a few files you can open in any editor:
Need one file for a script or pipeline instead?
Put it through CloudOpsBench
Curious how OpenSRE stacks up? CloudOpsBench is a 452-scenario Kubernetes RCA suite — you can run OpenSRE against it and compare to published LLM-only baselines.Show us what you built
Got a demo, a runbook, or a post-mortem that used OpenSRE?- Post in GitHub Discussions with the Showcase tag — include the commands you ran, which tools were connected, and redacted output if you can.
- Join the bi-weekly giveaway when you share something — there’s OpenSRE swag in the mix.